Customizing the pipeline
Reading the corpus
The Corpus class that represents the feature matrix which is the starting point for the analysis basically is a data frame that maps combinations of documents and features to feature counts. When building the representation, it uses two helper classes to decouple aspects that are relevant for building the feature matrix: FeatureGenerator performs the actual reading and feature counting, DocumentDescriber provides labels and groupings for the documents that can be used in visualization and evaluation steps.
When you just create a corpus using delta.Corpus(directory), default versions will be used, but stuff can be customized:
[1]:
import delta
from matplotlib import pyplot as plt
help(delta.Corpus.__init__)
Help on function __init__ in module delta.corpus:

__init__(self, source=None, /, *, subdir=None, file=None, corpus=None, feature_generator=None, document_describer=<delta.util.DefaultDocumentDescriber object at 0x7f9fd139d070>, metadata=None, **kwargs)
    Creates a new Corpus.

    You can create a corpus either from a filesystem subdir with raw text files, or from a CSV file with
    a document-term matrix, or from another corpus or dataframe that contains (potentially preprocessed)
    document/term vectors. Either option may be passed via appropriately named keyword argument or as
    the only positional argument, but exactly one must be present.

    If you pass a subdirectory, Corpus will call a `FeatureGenerator` to read and parse the files and to
    generate a default word count. The default implementation will search for plain text files ``*.txt``
    inside the directory and parse them using a simple regular expression. It has a few options, e.g.,
    ``glob`` and ``lower_case``, that can also be passed directly to corpus as keyword arguments. E.g.,
    ``Corpus('texts', glob='plain-*.txt', lower_case=True)`` will look for files called plain-xxx.txt and
    convert it to lower case before tokenizing. See `FeatureGenerator` for more details.

    The ``document_describer`` can contain per-document metadata which can be used, e.g, as ground truth.

    The ``metadata`` record contains global metadata (e.g., which transformations have already been performed),
    they will be inherited from a ``corpus`` argument, all additional keyword arguments will be included
    with this record.

    Args:
        source: Positional variant of either subdir, file, or corpus
        subdir (str): Path to a subdirectory containing the (unprocessed) corpus data.
        file (str): Path to a CSV file containing the feature vectors.
        corpus (pandas.DataFrame): A dataframe or :class:`Corpus` from which to create a new corpus, as a copy.
        feature_generator (FeatureGenerator): A customizeable helper class that will process a `subdir` to a feature matrix, if the `subdir` argument is also given. If None, a default feature generator will be used.
        metadata (dict): A dictionary with metadata to copy into the new corpus.
        **kwargs: Additionally, if feature_generator is None and subdir is not None, you can pass FeatureGenerator
            arguments and they will be used when instantiating the feature generator
            Additional keyword arguments will be set in the metadata record of the new corpus.
E.g., to create a corpus that ignores case differences and reads only the first 5000 tokens of each text (lower_case and max_tokens are arguments to the default FeatureGenerator):
[2]:
corpus = delta.Corpus('../../refcor/English', lower_case=True, max_tokens=5000)
corpus.iloc[:5,100:110]
[2]:
| say | sir | how | its | house | way | after | father | long | mother | |
|---|---|---|---|---|---|---|---|---|---|---|
| ward_ashe | 6.0 | 2.0 | 10.0 | 4.0 | 8.0 | 5.0 | 6.0 | 4.0 | 3.0 | 17.0 |
| blackmore_springhaven | 2.0 | 1.0 | 7.0 | 12.0 | 3.0 | 7.0 | 5.0 | 5.0 | 9.0 | 2.0 |
| stevenson_island | 5.0 | 4.0 | 4.0 | 0.0 | 7.0 | 10.0 | 5.0 | 12.0 | 5.0 | 5.0 |
| thackeray_esmond | 8.0 | 3.0 | 10.0 | 3.0 | 9.0 | 2.0 | 17.0 | 14.0 | 5.0 | 13.0 |
| ward_milly | 4.0 | 1.0 | 14.0 | 5.0 | 8.0 | 11.0 | 5.0 | 15.0 | 12.0 | 48.0 |
It is also possible to roll your own feature generator. As an example, we would like to use lemmas instead of word forms as features. For that, we would like to read a version of our corpus that has been preprocessed using the DARIAH DKPro wrapper.
A file like this is essentially a table that contains a line per token with various analyses in the columns:
[3]:
import pandas as pd
import csv
dof_example = pd.read_table('../../refcor/dof/German/Huber,-Therese_Luise.txt.csv', quoting=csv.QUOTE_NONE, sep='\t')
dof_example.iloc[1003:10010]
[3]:
| SectionId | ParagraphId | SentenceId | TokenId | Begin | End | Token | Lemma | CPOS | POS | ... | Morphology | Hyphenation | DependencyHead | DependencyRelation | NamedEntity | QuoteMarker | CoreferenceChainIds | SyntaxTree | Predicate | SemanticArgumentIndex | |
|---|---|---|---|---|---|---|---|---|---|---|---|---|---|---|---|---|---|---|---|---|---|
| 1003 | _ | 8 | 24 | 1003 | 5826 | 5836 | Thatsachen | Thatsachen | NN | NN | ... | _ | That-sa-chen | 1002 | NK | _ | 0 | _ | _ | _ | _ |
| 1004 | _ | 8 | 24 | 1004 | 5837 | 5844 | annimmt | annehmen | V | VVFIN | ... | _ | an-nimmt | 991 | CJ | _ | 0 | _ | _ | _ | _ |
| 1005 | _ | 8 | 24 | 1005 | 5844 | 5845 | , | , | PUNC | $, | ... | _ | , | 1004 | -- | _ | 0 | _ | _ | _ | _ |
| 1006 | _ | 8 | 24 | 1006 | 5846 | 5848 | so | so | ADV | ADV | ... | _ | so | 1007 | MO | _ | 0 | _ | _ | _ | _ |
| 1007 | _ | 8 | 24 | 1007 | 5849 | 5853 | wird | werden | V | VAFIN | ... | _ | wird | -1 | -- | _ | 0 | _ | _ | _ | _ |
| ... | ... | ... | ... | ... | ... | ... | ... | ... | ... | ... | ... | ... | ... | ... | ... | ... | ... | ... | ... | ... | ... |
| 10005 | _ | 26 | 312 | 10005 | 55649 | 55650 | ; | ; | PUNC | $. | ... | _ | ; | 10004 | -- | _ | 0 | _ | _ | _ | _ |
| 10006 | _ | 26 | 312 | 10006 | 55651 | 55654 | sie | sie | PR | PPER | ... | _ | sie | 10007 | SB | _ | 0 | _ | _ | _ | _ |
| 10007 | _ | 26 | 312 | 10007 | 55655 | 55660 | sagte | sagen | V | VVFIN | ... | _ | sag-te | 9997 | CJ | _ | 0 | _ | _ | _ | _ |
| 10008 | _ | 26 | 312 | 10008 | 55661 | 55664 | ihm | er | PR | PPER | ... | _ | ihm | 10007 | DA | _ | 0 | _ | _ | _ | _ |
| 10009 | _ | 26 | 312 | 10009 | 55665 | 55669 | kein | keine | PR | PIAT | ... | _ | kein | 10010 | NK | _ | 0 | _ | _ | _ | _ |
9007 rows × 21 columns
So, here is a simple lemma-based feature generator:
[4]:
class DOFLemmaFG(delta.FeatureGenerator):

    def process_file(self, filename):
        dof = pd.read_table(filename, sep='\t', quoting=csv.QUOTE_NONE)
        tokens = dof[dof.CPOS != 'PUNC']                  # only non-punctuation tokens
        counts = tokens.Lemma.value_counts()              # count the different values -> Series
        counts.name = self.get_name(filename)
        return counts
Now, we can pass this in to Corpus:
[5]:
lemma_corpus = delta.Corpus('../../refcor/dof/German', feature_generator=DOFLemmaFG(glob='*.txt.csv'), parallel=True)
lemma_corpus.iloc[0:5,125:130]
[5]:
| lieb | glauben | Mutter | ob | beide | |
|---|---|---|---|---|---|
| Goethe,-Johann-Wolfgang_Die%20Wahlverwandtschaften.txt | 64.0 | 69.0 | 24.0 | 55.0 | 93.0 |
| Raabe,-Wilhelm_Im%20alten%20Eisen.txt | 121.0 | 21.0 | 149.0 | 40.0 | 71.0 |
| Arnim,-Ludwig-Achim-von_Armut%20Reichtum%20Schuld%20und%20Buße%20der%20Gräfin%20Dolores.txt | 152.0 | 124.0 | 95.0 | 107.0 | 188.0 |
| Fischer,-Caroline-Auguste_Die%20Honigmonathe.txt | 23.0 | 78.0 | 52.0 | 36.0 | 3.0 |
| Ebner-Eschenbach,-Marie-von_Bozena.txt | 39.0 | 33.0 | 74.0 | 44.0 | 57.0 |
Rest of the steps can be performed as before:
[6]:
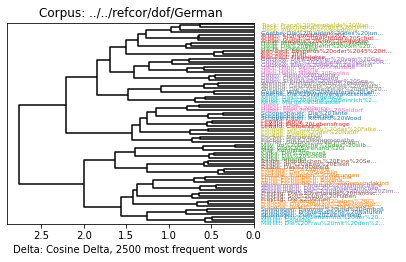
c2500 = lemma_corpus.get_mfw_table(2500)
distances = delta.functions.cosine_delta(c2500)
clustering = delta.Clustering(distances)
delta.Dendrogram(clustering).show()
/home/tv/git/pydelta/delta/graphics.py:88: MatplotlibDeprecationWarning: Passing the pad parameter of tight_layout() positionally is deprecated since Matplotlib 3.3; the parameter will become keyword-only two minor releases later.
  plt.tight_layout(2)
[7]:
pd.concat((distances.evaluate(), clustering.fclustering().evaluate()))
[7]:
F-Ratio                0.364821
Fisher's LD            1.501815
Simple Score           3.829410
Cluster Errors         1.000000
Adjusted Rand Index    0.965961
Homogeneity            0.990683
Completeness           0.992079
V Measure              0.991380
Purity                 0.986667
Entropy                0.009317
dtype: float64
Deltas and Normalizations
pyDelta provides a number of different delta functions, and it’s easy to roll your own. You can list all available delta functions by looking at delta.functions. The functions are then available as, e.g., delta.functions.burrows(corpus), and they all return a distance matrix.
[8]:
delta.functions
[8]:
Delta Functions
Linear Delta= lineardistance= linear2_classic_delta= burrows2manhattanManhattan DistanceeuclideanEuclidean DistancesqeuclideanSquared Euclidean DistancecosineCosine DistancecanberraCanberra DistancebraycurtisBray-Curtis DistancecorrelationCorrelation DistancechebyshevChebyshev DistanceburrowsBurrows' Delta = manhattan-z_scorequadraticQuadratic Delta = sqeuclidean-z_scoreederEder's Delta = manhattan-z_score-eder_stdeder_simpleEder's Simple = manhattan-sqrtcosine_deltaCosine Delta = cosine-z_score
Normalizations
- z_score (Z-Score)
- eder_std
- binarize
- length_normalized
- diversity_scaled
- sqrt
- clamp
- ternarize
Some of the functions (e.g., euclidean) are simply wrappers around the corresponding functions of scipy.spatial.distance. So, if you would like to provide the Minkowski norm with \(p = \frac{1}{2}\), you can simply create the function using the wrapper class:
[9]:
delta.MetricDeltaFunction('minkowski', name='l_half', title='Minkowki Norm $L_½$', p=1/2)
[9]:
l_half Minkowki Norm $L_½$While it is possible to implement a delta function from scratch (linear delta is such a case), most “interesting” functions are a composite delta function, i.e. a combination of one or more normalizations and a basis distance function. E.g., Burrows’ classic delta works by first normalizing the distance matrix to z-scores and then applying manhatten distance:
[10]:
delta.functions.burrows
[10]:
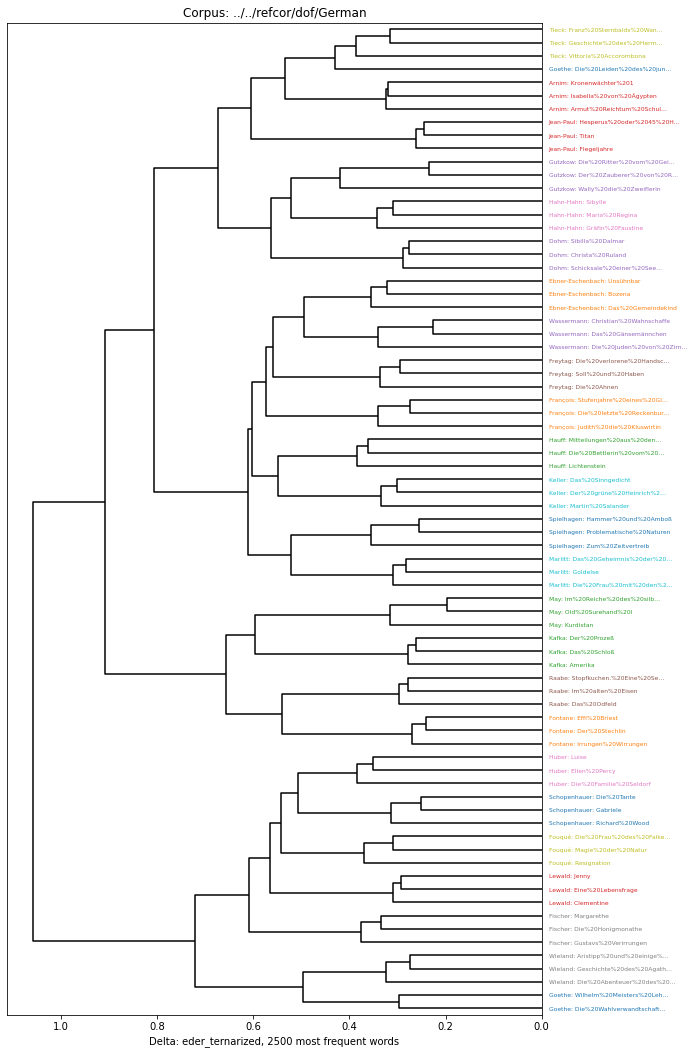
burrows Burrows' Delta = manhattan-z_scoreWe can also roll our own. E.g., the ternarize normalization reduces the z-scores to -1, 0, or 1:
[11]:
delta.CompositeDeltaFunction(name='eder_ternarized', descriptor='manhattan-z_score-ternarize-eder_std')
[11]:
eder_ternarized = manhattan-z_score-ternarize-eder_stdNow we’re able to run our analyzis on this:
[12]:
et_clust = delta.Clustering(delta.functions.eder_ternarized(c2500))
plt.figure(figsize=(10,15))
delta.Dendrogram(et_clust).show()
/home/tv/git/pydelta/delta/graphics.py:88: MatplotlibDeprecationWarning: Passing the pad parameter of tight_layout() positionally is deprecated since Matplotlib 3.3; the parameter will become keyword-only two minor releases later.
  plt.tight_layout(2)
You can also define your own normalizations. E.g., the original z-score normalization has been defined by these few lines:
[13]:
@delta.normalization(title="Z-Score")
def z_score(corpus):
    """Normalizes the corpus to the z-scores."""
    return (corpus - corpus.mean()) / corpus.std()
Registering z_score (Z-Score) as z_score, replacing existing function with this name
[ ]: